
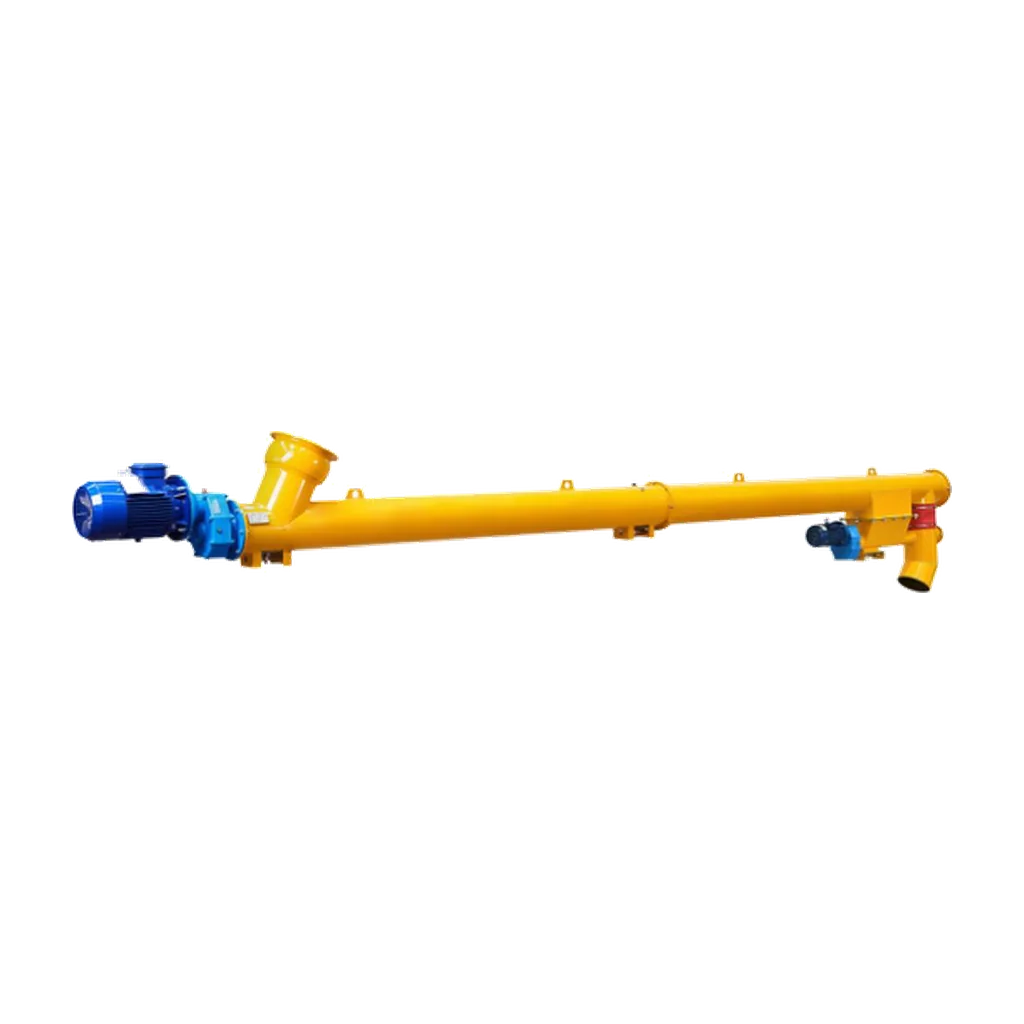
Cement screw conveyor speed selection starts with volumetric demand, not a preferred motor RPM. Convert mass flow across the credible density range, choose diameter and loading, determine verified capacity per revolution, and check the result against inclination, aeration, wear, bearings, power and restart torque.
VOGO’s tubular cement screw conveyor range uses project-specific drives. The standard motor reference is not the screw-shaft speed; the reducer establishes final RPM.
Confirm Conveyor or Feeder Duty
This method applies to a control-fed conveyor. A continuously covered inlet under storage is a screw feeder. Feeder speed is tied to control pitch and inlet geometry, which may require increasing pitch or tapered geometry. The silo discharge guide covers that case.
Convert Mass Flow to Volume
Volumetric flow (m³/h) = mass flow (t/h) ÷ density (t/m³)
For 20 t/h and 1.0 to 1.25 t/m³:
- 20 ÷ 1.25 = 16.0 m³/h
- 20 ÷ 1.0 = 20.0 m³/h
Low density governs volume; high density still matters for power and restart.
Cement Screw Conveyor Speed Selection Method
The KWS capacity method selects diameter and loading, then calculates RPM from capacity at one rpm. ANSI/CEMA 350 supplies the industry framework.
Screw speed = required selection capacity ÷ verified capacity per rpm
Capacity per revolution changes with diameter, shaft, pitch, flight geometry and loading. Inclined fallback and aerated cement can reduce delivery.
| Decision | Lower speed tendency | Higher speed tendency |
|---|---|---|
| Material | Less agitation and wear | More agitation and dust |
| Torque | More torque for equal power | Less steady torque for equal power |
| Bearings and seals | Lower surface speed | More heat and wear risk |
| Incline | May allow fallback | May improve transport only within a tested range |
| Control | Limits maximum rate | Adds range but not guaranteed linearity |
KWS material guidance notes that aerating materials can flood downstream equipment; lower loading and slower speed may help. Higher RPM is therefore not a universal fix.
Worked RPM Example
Assume selection volume is 20 m³/h and the supplier’s verified value is 0.32 m³/h per rpm:
20 ÷ 0.32 = 62.5 rpm
The assumed 0.32 value is not VOGO data. Check the resulting speed against material and diameter limits, hanger-bearing limits, power, reducer torque, VFD range, incline and loaded restart. The KWS calculator can screen horizontal control-fed duty.
Specify and Test the Range
Define minimum, normal and maximum screw speed; turndown; torque at minimum speed; motor cooling; ramps; zero-speed and overspeed thresholds; and calibration method. At three speeds, record delivered mass, density, current, temperature, noise, leakage and downstream stability. Nonlinearity can signal unstable inlet flow, aeration, fallback or restriction.
The inclination guide explains why angle cannot be reduced to one RPM multiplier.
Check Maximum Speed Against the Material and Components
The maximum recommended speed in a design table is a boundary, not a target. Larger screws generally use lower rotational speeds because flight-tip speed and dynamic forces rise with diameter. Special pitches, cut flights, hanger bearings and seals can impose lower limits.
Calculate flight-tip speed as a reasonableness check:
Tip speed (m/s) = π × screw outside diameter (m) × rpm ÷ 60
A 0.273 m screw at 63 rpm has a tip speed of about 0.90 m/s. This example does not establish an allowable value. It makes comparisons visible: at the same RPM, increasing diameter raises surface speed, potential wear and dynamic effects.
Record maximum allowed RPM for the screw, bearings, seals, coupling and reducer. The lowest verified limit governs.
Plan for Aerated and Settled Cement
Cement leaving a pneumatic fill or aeration system can have a lower bulk density and behave more fluidly. It consumes more conveyor volume per tonne and may surge into an inlet. Settled cement has a higher bulk density and can demand more torque. A speed selected from one laboratory density can therefore miss both operating extremes.
Specify the time between silo filling and conveying, aeration state, moisture and any additives such as fly ash. During commissioning, sample density close to the conveyor inlet rather than substituting a generic handbook value.
A speed increase cannot correct unstable upstream flow. If a control valve alternates between starving and flooding the conveyor, fix the valve or control loop. If the inlet remains continuously flooded, reclassify the equipment as a feeder and review withdrawal design.
Coordinate Diameter, Pitch and Speed
When calculated RPM is too high, do not automatically exceed the material limit. Revisit diameter, trough loading and pitch. A larger diameter may deliver the required volume at a lower speed, but it increases screw and material mass and can raise startup torque. A different pitch changes displacement and material behavior. Each change must be returned to capacity and power calculations.
When RPM is very low, verify that material advances without excessive slip or fallback, especially on an incline. Also confirm that the motor/VFD can provide continuous torque and cooling at that speed.
Speed-Control Cause-and-Effect Table
| Observation | Possible interpretation | Next check |
|---|---|---|
| Rate proportional to RPM | Stable inlet and filling in tested range | Confirm at density extremes |
| Rate flattens at high RPM | Poor filling, aeration or fallback | Inlet, material state and incline |
| Current rises while rate falls | Restriction, recirculation or overfill | Discharge and casing condition |
| Rate hunts at constant RPM | Upstream surge or density change | Feed device and silo condition |
| High bearing temperature | Speed, lubrication or alignment issue | Bearing limits and installation |
| Zero-speed trips at low setpoint | Sensor threshold or insufficient torque | Actual shaft motion and drive tuning |
Specify Capacity Accuracy Honestly
A conveyor is not automatically a precision feeder. If the process requires accurate dosing, state the permitted mass-flow error, turndown, calibration method and response time. A weigh system or loss-in-weight feeder may be required. VFD frequency alone reports commanded speed, not delivered mass.
Keep calibration records tied to cement source and condition. Recalibrate after changing screw, pitch, clearance, seal drag or control range. This preserves the boundary between a verified operating curve and a catalog estimate.
Supplier Data Required for RPM Approval
Send minimum, normal and peak mass flow; minimum and maximum bulk density; cement source and aeration state; screw diameter, shaft diameter, pitch, angle, length and loading; bearing and seal types; motor and reducer data; and required turndown.
Require the proposal to state nominal RPM, permitted range, capacity basis, maximum component speed, power at range limits and commissioning calibration method. The approved drawing and VFD parameter list should agree.
Review After Wear or Material Change
Flight wear increases clearance and can change delivered capacity at a given RPM. A new cement source, moisture change or higher fly-ash proportion can also alter filling and density. Recheck the speed-capacity curve after a major screw repair or a persistent process change.
Do not restore lost output only by raising maximum frequency. First verify mechanical condition, actual shaft speed and the current approved component limits.
Conclusion
Cement screw conveyor speed selection starts from governing volume and verified displacement per revolution, followed by checks for cement condition, inclination, component limits, power and restart torque. Do not assume capacity rises linearly without limit. Give the supplier the density range, geometry, flight arrangement and VFD range for confirmation.